Definition | Examples | Formula | Calculation |“Good” YOY Growth | Benefits
You can’t be in the world of business, finance, or investing and not hear the term “year-over-year” (YoY) at least once a day.
But do you 100% understand what exactly it means and how to use it to your best advantage?
Keep reading to reveal the most important and useful aspects of YoY growth, including:
For instance, you would compare the first quarter of 2021 with the first quarter of 2020, because they share the same period length.
YOY can be positive, negative or zero – indicating increasing, decreasing or stagnating trend in the measured statistic.
Good news, YOY is very easy to calculate!
Year-over-Year Growth (YOY) Formula:
Or you can use these alternatives of the formula that are even more simplified:
The YOY calculation is simple and takes 4 easy steps:
| YoY Calculation in 4 Steps | Example |
|---|---|
| Step 1 | |
| Select the two data points you want to evaluate–one for the period you are examining, and another recorded 12 months prior. | This year’s Q4 (= 4th quarter) revenue: $150,000 |
| Last year’s Q4 revenue: $100,000 | |
| Step 2 | |
| Subtract the old number from the new number. That gives you the difference for the year. Positive change indicates a year-over-year increase–and vice versa. | On a YOY basis, revenues increased by $50,000 ($150,000 – $100,000 = $50,000) for the fourth quarter this year. |
| Step 3 | |
| Divide the difference from Step 2 by the old number. That gives you the YOY growth rate as a decimal. | That's $50,000 divided by $100,000 paintings: ($50,000 / $100,000 = 0.5) |
| Step 4 | |
| Multiply the YOY growth rate decimal number from Step 3 by 100 (= move the decimal point over 2 places to the right) to convert it into percentage format and arrive at the year-over-year percentage change. | (100 * 0.5) = 50% YOY Revenue Growth Rate |
| Conclusion | |
| In Q4, the company achieved revenue growth of 50% ($150,000 – $100,000) / $100,000), compared to the same period last year–YoY. This is a positive sign indicating that the company is growing year-over-year. | |
Note: Depending on the requirements of the calculation, such as the level of precision needed, you can round the percentage to the near whole number or even keep working in decimals.
Here are some additional examples of how YOY is used in real-life:
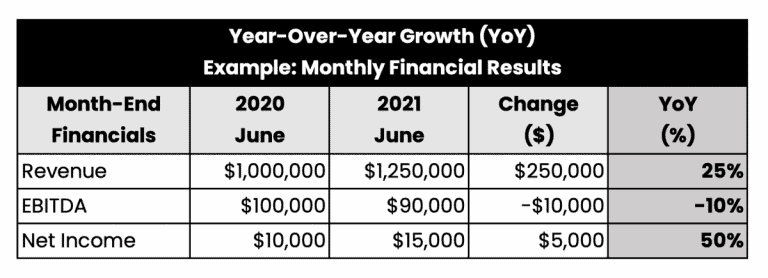
An analyst in an investment firm is comparing the key financial results–Revenue, EBITDA and Net Income–of a company for the month of June in years 2020 and 2021.

While the Revenues have increased by 25%, the EBITDA has shrunk by 10%. This indicates that even though the company was able to attract more customers and/or generate higher volume sales, there were some operational inefficiencies or other issues affecting its profit margins. Nevertheless, the company has still managed to increase its net profit by 50%
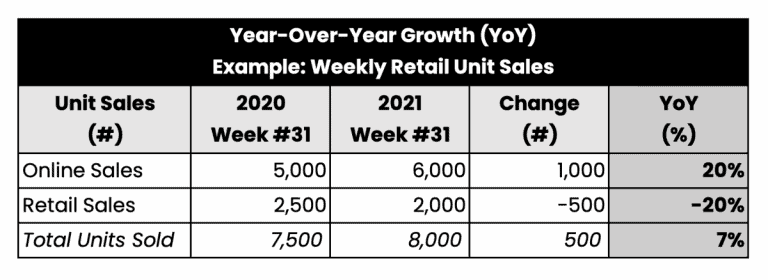
A retailer is comparing its online and high-street sales for the 31st week in years 2020 and 2021.

The offline sales dropped by 20%, however, this decrease was balanced out by a 20% increase in online sales. Overall, the company sold 7% more units in Week #31 of year 2021 than the previous year.
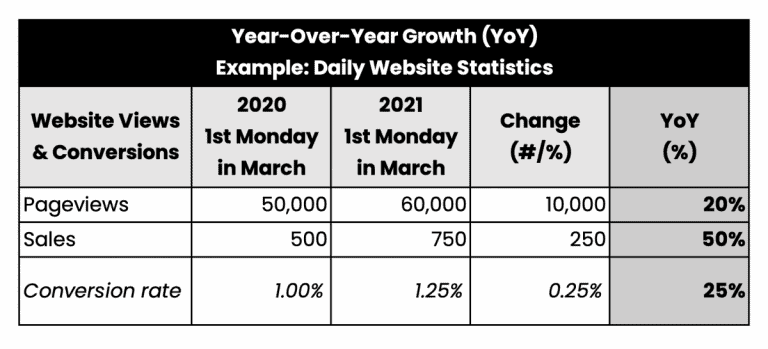
An educational website is comparing its page views and online course sales on the 1st Monday of March 2021 against the same day in the previous year 2020.

Both the pageviews and sales have increased YOY by 20% and 50% respectively, resulting in an overall 25% YOY increase in conversion rate.
Unlike standalone quarterly/monthly/weekly metrics, YOY gives you a clearer picture of performance without seasonal effects, monthly volatility, and other factors.
It also provides an objective view of the overall long-term performance.
Knowing your company’s year-over-year growth can be written proof that your company is succeeding and will continue to succeed. Calculating and showcasing your year-over-year growth can be beneficial for the following 5 reasons:
Arguably, the biggest advantage of year-over-year comparisons is that they minimize the effect of seasonality.
Many businesses operate on predictable seasonal cycles.
For instance, retailers experience peak demand during the holiday shopping season in the fourth quarter of the year (October to December).
In this case, the traditional “sequential” analysis that is designed to measure linear growth by comparing one month or quarter to the next (e.g., October 2022 vs November 2022; or Q4 2022 vs Q1 2023) would produce skewed results. And so would looking at the retailers’ financial metrics across one calendar year.
Instead, year-over-year growth compares metrics to the same time period last year (e.g.; October 2022 vs October 2021; or Q4 2022 vs. Q4 2021) for a more accurate performance comparison that shows true growth/decline without the impact of seasonal extremes.
Another advantage of the year-on-year metric is that it provides results in percentage terms, which are convenient for comparing companies of different sizes as part of market and competitor analysis.
YOY calculation can also smooth out volatility throughout the year to compare the overall net results.
Similarly to seasonality, business performance can vary over the course of a year. As a result, sequential analysis could make a business appear unstable.
In contrast, year-over-year comparison of specific months or quarters can make the analysis look more reliable to stakeholders.
In addition to mitigating the issue of seasonality and volatility, YOY offers another benefit: long-term performance analysis.
As the name suggests, YOY helps measure long-term growth year to year, not just month to month.
Consequently, it allows us to recognize trends over time and provides insight into whether short-term goals are leading to long-term results.
And last but not least, the year-over-year growth is a very easy metric to calculate, understand and use.
YOY is frequently used in financial analysis and data analytics to compare time series data in the world of business, finance and economics.
In business and finance, YOY is a popular way for owners, shareholders, managers, investors, lenders, business partners and other stakeholders of a company to evaluate its performance, growth patterns and trends, including the following financial metrics:
In economics, the economic situation of markets, countries and other entities are often analysed through the YOY lens.
Now that you have all the essential information about YOY, you might wonder:
What is the ideal year-over-year growth?
There is no one universal answer. What constitutes a good year-over-year growth rate is specific to each and every entity, depending on many factors, including:
As an alternative to YoY analysis, you may come across other time-series data measurements, such as:
| YoY (Year-over-Year) Alternatives | |
|---|---|
| Month-to-Date (MTD): | Measures a certain metric from the beginning of the current month up until the current date, but excluding today’s date. |
| Quarter-to-Date (QTD): | Measures a certain metric from the beginning of the current quarter up until the current date, but excluding today’s date. |
| Year-to-Date (YTD): | Measures growth change of a certain metric from the beginning of the year, calendar or fiscal, until the present date. |
| Month-over-Month (MoM): | Measures growth change of a certain metric by comparing the difference in its value between two consecutive months. |
| Quarter-over-Quarter (QoQ): | Measures growth change of a certain metric by comparing the difference in its value between two consecutive quarters (i.e., three-month period). |
In order to enable a comprehensive evaluation of an entity, the year-over-year growth analysis should be used in combination with other methods of analysis, including (but certainly not limited to) the annual, quarterly and monthly metrics.
Sign up for our Newsletter
Get more articles just like this straight into your mailbox.
Related Posts
Recent Posts